work > IDOC

big muddy river
pigment print
34 in x 34 in
2013
centralia
pigment print
34 in x 34 in
2013
danville
pigment print
34 in x 34 in
2013
decatur
pigment print
34 in x 34 in
2013
dixon
pigment print
34 in x 34 in
2013
dwight
pigment print
34 in x 34 in
2013
east moline
pigment print
34 in x 34 in
2013
graham
pigment print
34 in x 34 in
2013
hill
pigment print
34 in x 34 in
2013
illinois river
pigment print
34 in x 34 in
2013
jacksonville
pigment print
34 in x 34 in
2013
lawrence
pigment print
34 in x 34 in
2013
lincoln & logan
pigment print
42 in x 42 in
2013
menard
pigment print
42 in x 42 in
2013
pinckneyville
pigment print
34 in x 34 in
2013
pontiac
pigment print
34 in x 34 in
2013
robinson
pigment print
34 in x 34 in
2013
shawnee & vienna
pigment print
34 in x 34 in
2013
sheridan
pigment print
34 in x 34 in
2013
southwestern illinois
pigment print
34 in x 34 in
2013
stateville
pigment print
42 in x 42 in
2013
tamms
pigment print
34 in x 34 in
2013
taylorville
pigment print
34 in x 34 in
2013
vandalia
pigment print
34 in x 34 in
2013
western illinois
pigment print
34 in x 34 in
2013

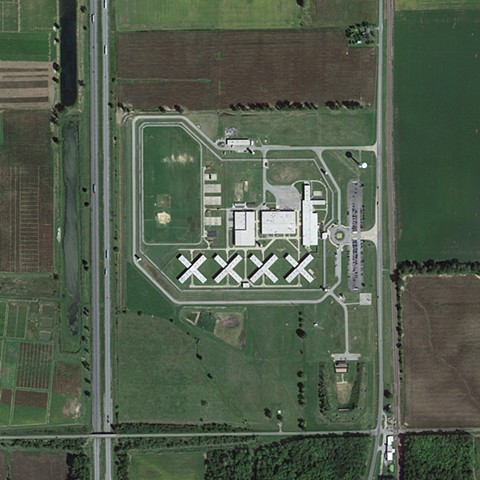
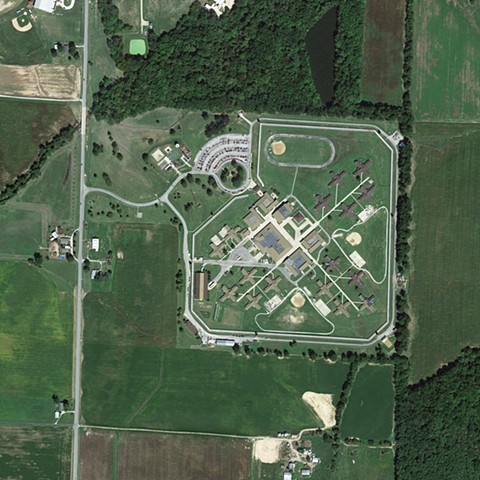
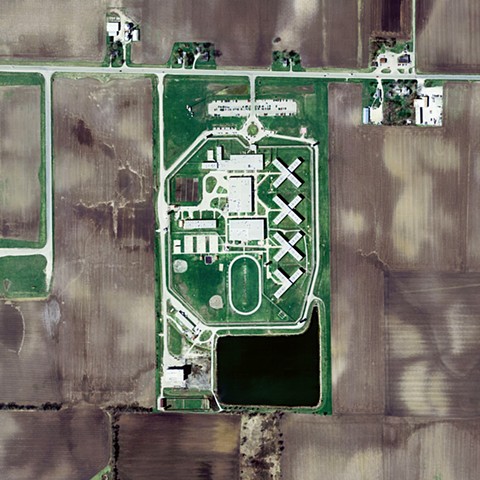
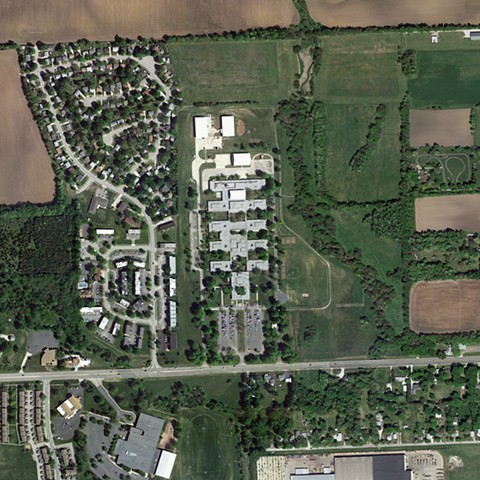
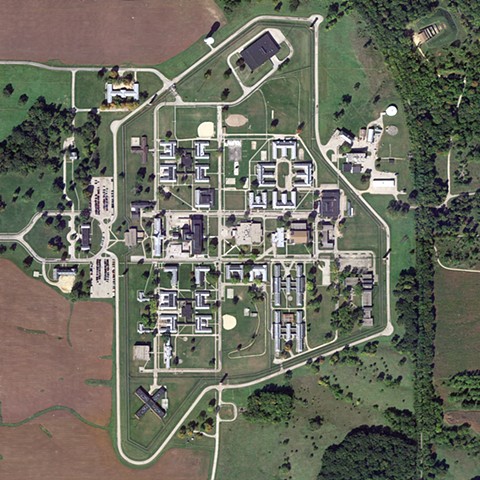
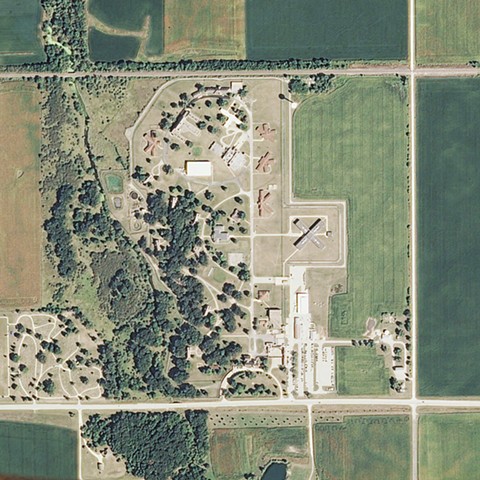
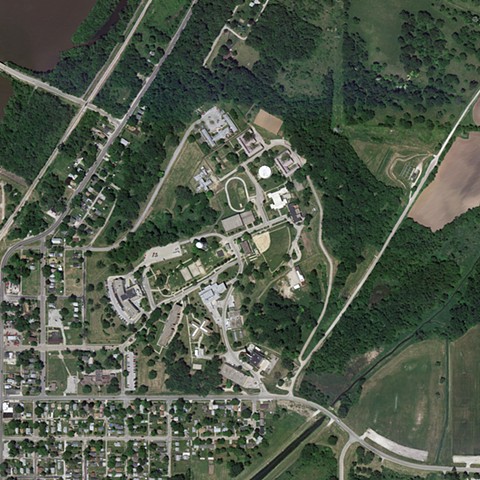
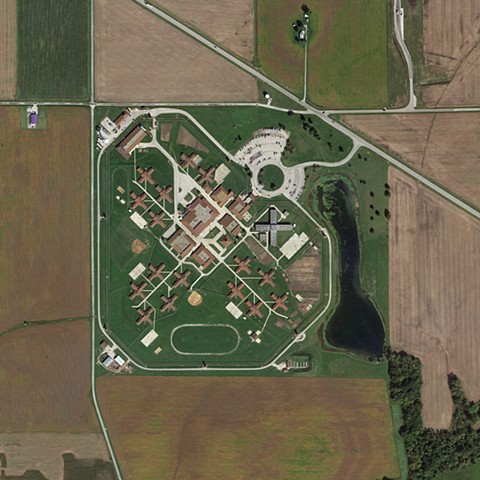
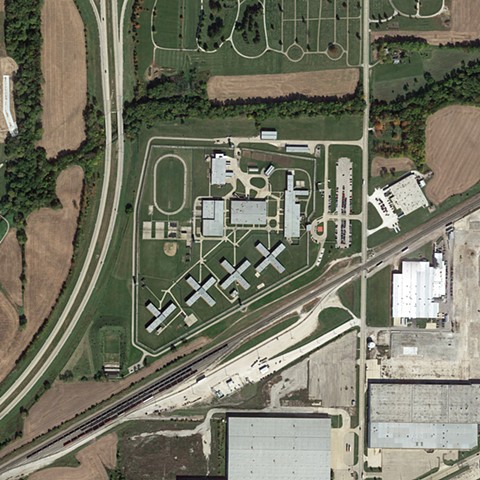
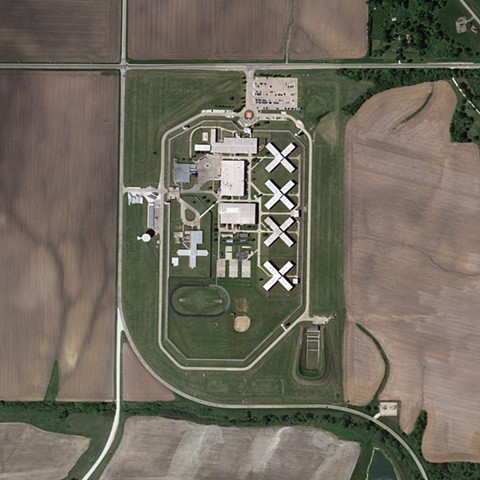
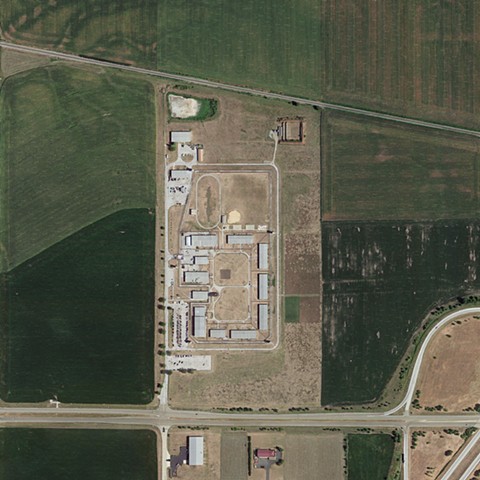
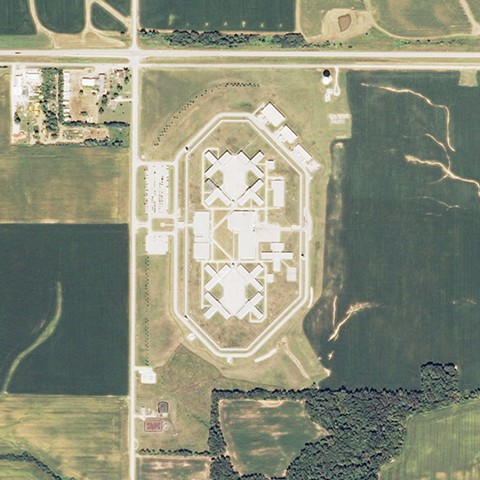
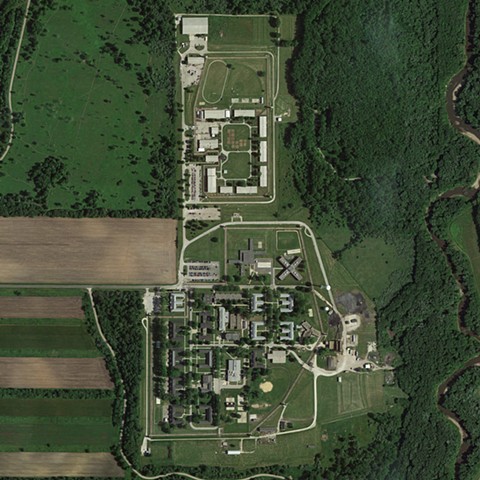
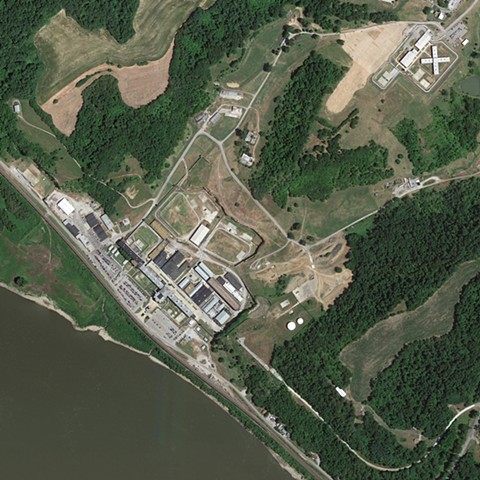
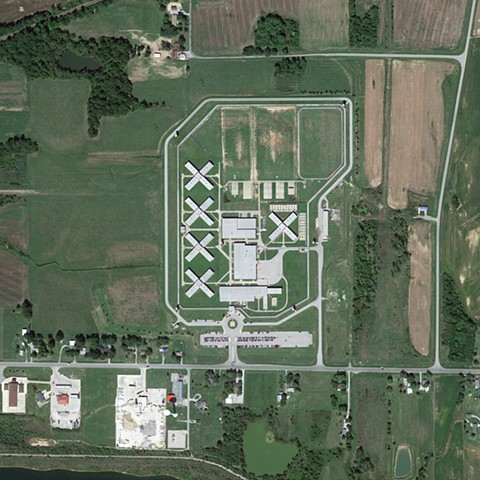
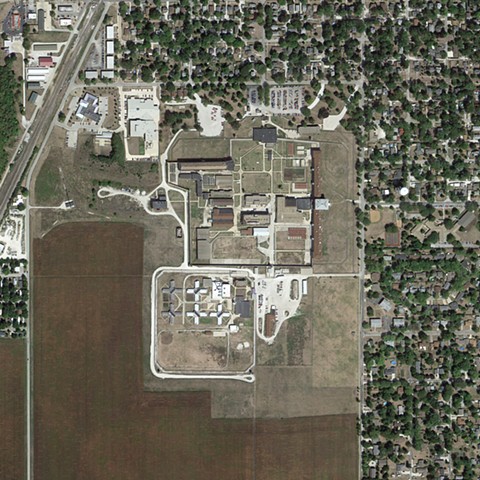
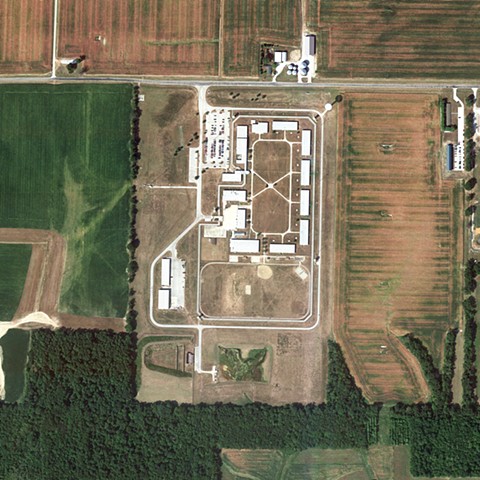
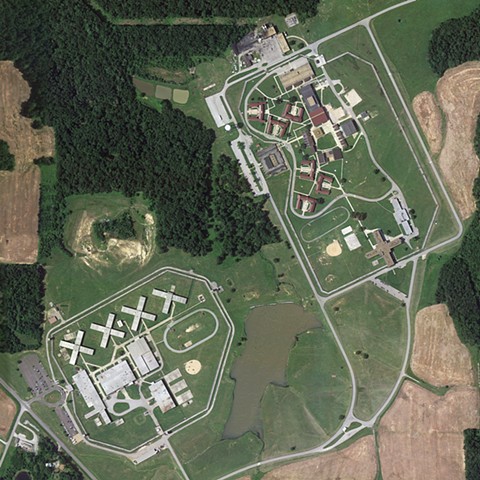
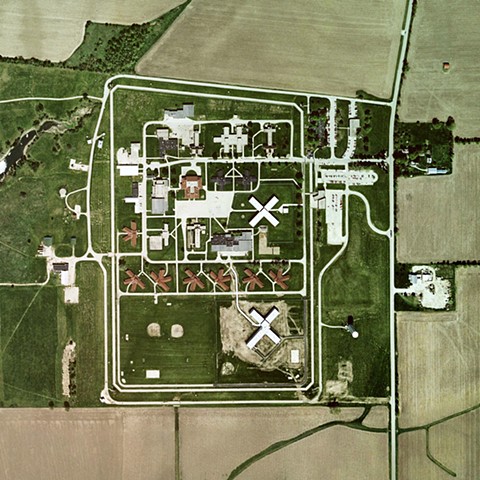
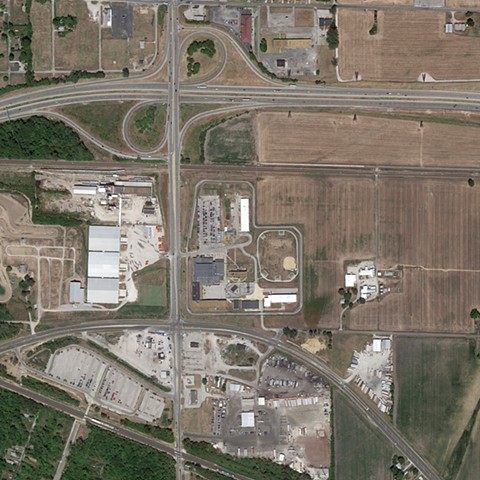
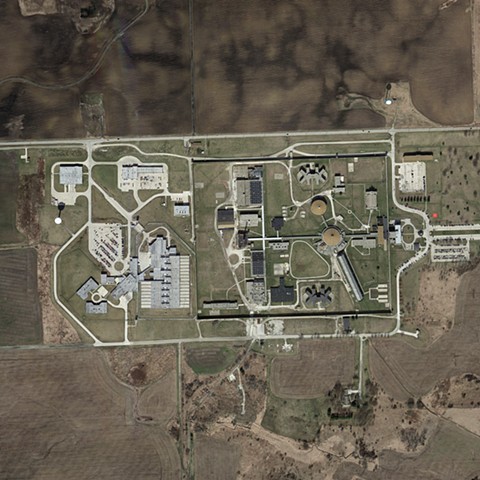
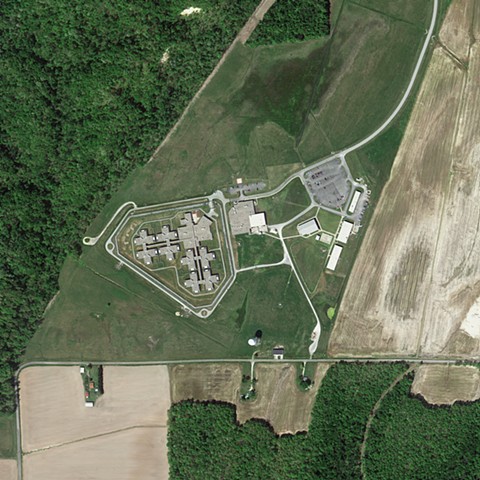
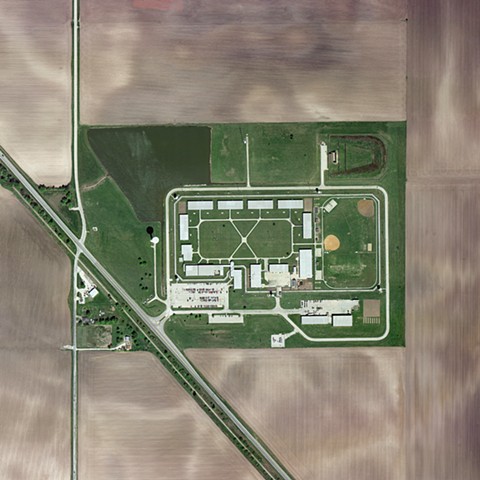
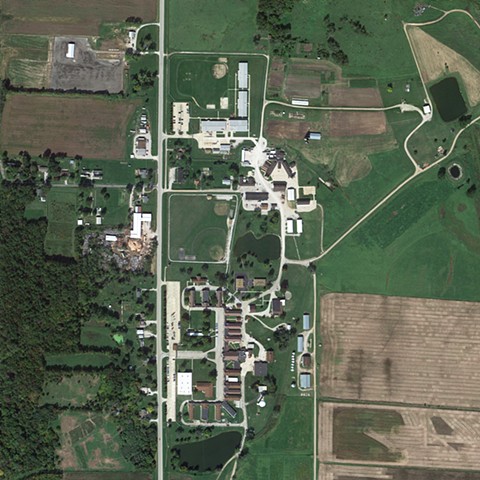
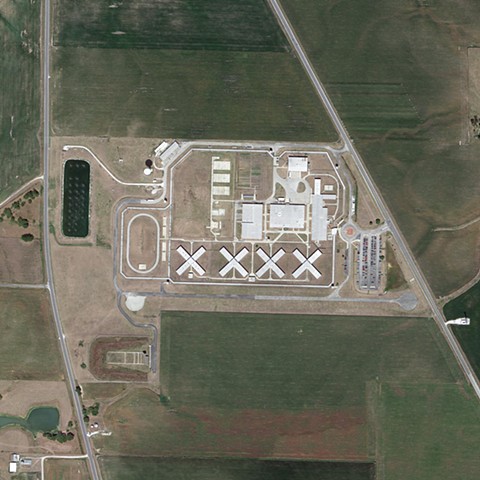
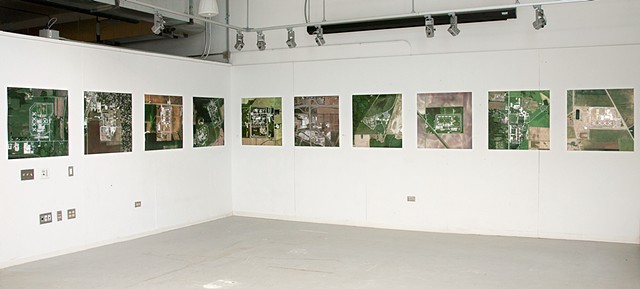
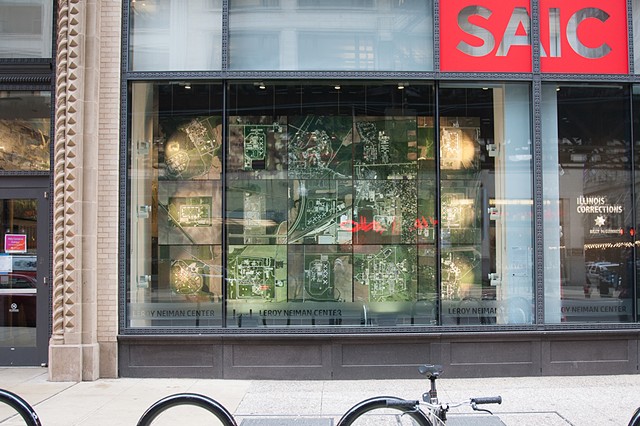
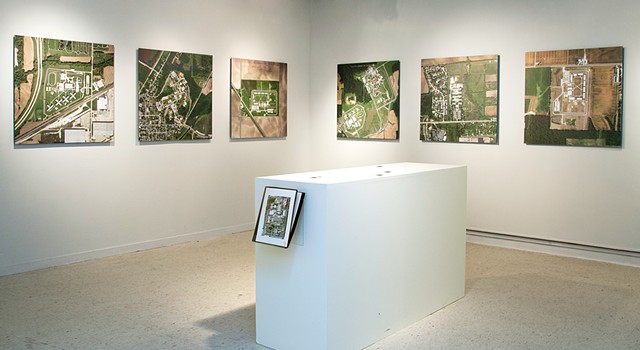
In 1978, the United States incarceration rate was 138 per 100,000 (1). By 2011, the rate had grown to 716 per 100,000 (2), an increase of over 400%. This project examines the architecture of mass incarceration with high-resolution composite photographs of the 27 Illinois Department of Corrections (IDOC) adult prison facilities, only 8 of which were built before 1980.

Note: 2 IDOC correctional centers, Tamms and Dwight, were closed in 2013.

IDOC population 2013: 45,367 (3)
IDOC system design capacity: 33,700 (4)
IDOC budget for 2013: $1.2 billion (5)
Estimated prison-related costs outside of the IDOC’s budget: $500 million (6)

Sources:
1 & 2 United States Bureau of Prison Statistics, U.S. Census Bureau
3 Illinois Department of Corrections
4 WBEZ Chicago
5 Office of Governor Pat Quinn, State of Illinois
6 Based on 2010 data provided by Vera Institute of Justice